What is Statistical Process Control?
SPC is a statistical method used for assessing variations in process and product characteristics. It involves:
- Providing indications for when a shift in the process has occurred and when the process should be left alone.
- Collecting data by measuring process and product characteristics.
- Analyzing data using statistics and exploratory data analysis.
- Making decisions based on statistical output.
- Acting on data-based decisions by understanding how processes work.
- Operating as a feedback system.
What is a Process?
The process is a combination of elements used to transform inputs into outputs. These elements typically include:
- Suppliers
- Material
- People
- Equipment
- Methods
- Environment
The Process Control System contributes to either maintaining a level of excellence or improving the total performance of the process.
What is Process Performance?
Process performance involves:
- Process output, which provides indications of performance.
- An understanding of the process itself and its variation.
- An assessment of Process characteristics and their proximity to the targets.
- The collection of data to ensure the process is behaving in a usual or unusual manner.
What is Quality?
Quality is defined by customers. It is the degree to which product and service characteristics meet the requirements. Customers seek products and services that are reliable. Furthermore, over the life of these products and services, they should be able to satisfy the customers’ needs and expectations. To achieve high quality output, a company must listen to both 'the voice of its processes' and 'the voice of the customers'.
To achieve high quality products and services, pro-active companies must:
- Pay attention to the input from their customers.
- Focus their attention on defect prevention, rather than defect detection.
- Practice process control, instead of product control.
- Continuously reduce the variation in manufacturing and service delivery processes.
What are statistics for?
Statistics serve the following purposes:
- Providing a numerical summary of the data being analyzed.
- Offering the basis for making predictions.
- Providing a common language within the organization to describe a process.
- Offering a foundation to assess process capability.
What are the Objectives of SPC?
The objectives of SPC are:
- To monitor controlled variation and detect uncontrolled variation in a process.
- To indicate when a process should be left alone and when a shift in the process has occurred due to assignable causes.
- To provide a common language for communicating the performance of a process between various operations.
- To create a process with predictable performance levels.
- To improve customer satisfaction.
What are the Benefits of SPC?
The benefits of SPC include:
- Guiding for conducting Statistical Process Management.
- Assisting in decision making in process management.
- Being extremely beneficial to manufacturing, non-manufacturing, and service industries.
- Offering a structure for continuous improvement.
- Reducing waste, improving overall quality, and saving money.
SPC is necessitated by the following:
- Various standards such as ISO 9001, IATF 16949, ISO 14001, AS9100D, ISO 13485, and ISO 17025 as well as other International Standards. For more information about these standards, you can explore our ISO training website.
- Customer Requirements.
- Any Continual Improvement activities.
- Statistical Process Control Core Tools Training
- Understanding Core Tools APQP, PPAP, PFMEA, Control Plans, SPC and MSA : AIAG FMEA 4th Edition Methodology
- Core Tools AIAG-VDA FMEA 1st Edition Methodology
- Core Tools AIAG-VDA FMEA 1st Edition Methodology
- Understanding Core Tools (APQP, PPAP, DFMEA, DVPR, SPC and MSA) AIAG FMEA 4th Edition Methodology
- Understand Statistical Process Control and Its Associated Tools
- APQP/PPAP, DFMEA & DVP&R, PFMEA/Control Plan, SPC and MSA Core Tools Training
- CQI-25: Understanding the SPC Quick Start Guide for Continuous Quality Improvement
- CQI-26: Understanding the SPC Short Run Supplement for Continuous Quality Improvement

What are the Tools That Can be Used?
Statistical Process Control (SPC), including:
 A variety of control charts
- 7 Basic Quality Tools
- Process Flow
- Histograms
- Run Charts
- Control Charts
- Cause and Effect Diagram
- Pareto Charts
- Scatter Diagram
- Distribution characterization
- Normal
- Non-Normal Distribution
- Graphical Tools such as:
- Box Plot
- Time Series Plot
- Normality plot
- Dot Plot
- Process Capability
- Hypothesis Tests
- Multi-Vary Chart
- Design of Experiments (DOE)
- Quality Function Deployment (QFD)
- Regression Analysis
- Process Control
- Process Optimization
For more information and resources related to these tools, please review our offerings on Omnex Lean Six Sigma Certification.
Fundamentals of Statistical Process Control
Variation
Variation affects all processes. Due to their inherent nature, processes cannot produce identical outputs. The process’s variation is estimated by observing the variation in the products produced.
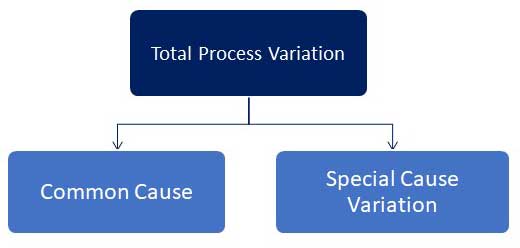
- Common causes of variation are the natural variations that reflect the process capability.
- Special causes of variations are unnatural variations, something is changing in the process.
- If only common causes of variation are present, the process output forms a distribution that is stable over time and predictable.
- If special causes of variation are present, the process output is not stable over time; we are unable to predict the results.
- We need to understand the process behaviour. If special causes of variation are present, we are unable to predict the results.
Two mistakes we can make:
- Rejecting good parts or over-controlling as if they came from a special cause of variation.
- Accepting bad parts as if they came from common causes of variation.
Data and Data Collection
Dr. Walter Shewhart, the father of SPC has two rules for the presentation of data:
- “Data should always be presented in such a way that preserves the evidence in the data for all the predictions that might be made from the data.”
- “Whenever an average, range, or histogram is used to summarize data, the summary should not mislead the user into taking any action that the user would not take if the data were presented in a time series.”
A data collection is a documentation of:
- What data will be collected
- Why it is needed
- Who is responsible
- How it will be collected
- When it will be collected
- Where it will be collected
Well-prepared data collection helps ensure the successful analysis of the problem. Data stratification can be applied.
Definitions of Basic Statistics
Population: Anything can be a population.
Sample: A subset of the population. You analyze the sample and make predictions for the population
Mean (average): The most common statistic to describe the data. It is a measure of central tendency. Because of the inherent variability in the process, the specific values of individual product characteristics lack significance in controlling the process. Their use is limited to acceptance or rejection of the respective product inspected. To estimate the center of the process, the Mean is used.
Range: The range is the most used measure of variability in SPC. It is the difference between the largest observation and the smallest observation in the data set. Range
The Normal Distribution
Data from a Normal Process will produce a continuous, symmetrical, bell-shaped curve.
Normal Theory and the Central Limit Theorem
This indicates that it is almost always the case that the shape of the distribution of values of ¯𝑋 is either exactly normal or approximately normal.
Control Charts
What are the Control Charts?
A graphical mean that compares current process data to a set of stable control limits from the normal process variation. This concept was first proposed by Dr. Walter A. Shewhart in 1924, introducing the concept of a state of statistical control.
The Only Way to Prove a Process is in Statistical Control is by Control Charts
Control Chart Road Map
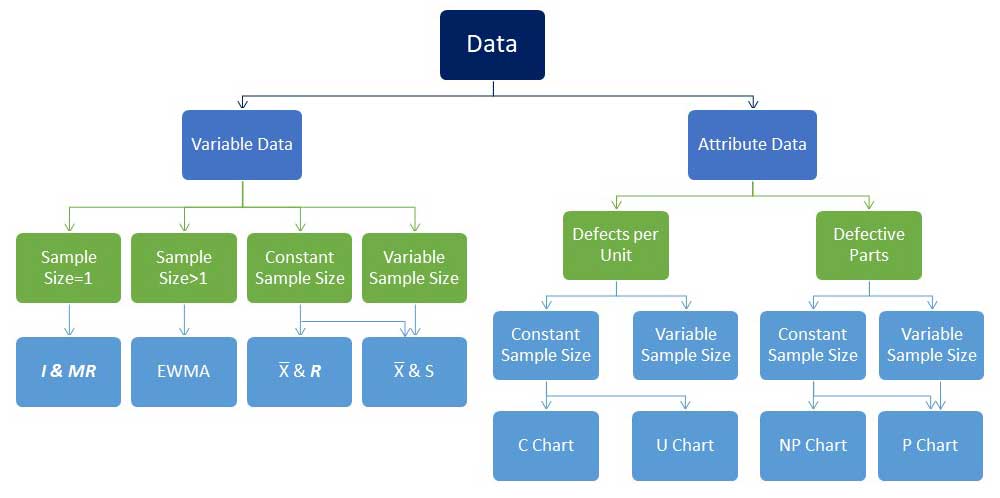
Other Types of Control Charts
- Individual and Moving Range Charts
- Median and Range Charts
- Moving Average and Moving Range Chart (𝑀𝑋 & 𝑀𝑅 charts)
- EWMA Charts (Exponentially weighted moving average chart)
- CUSUM Charts (Cumulative Sum Charts)
- Median and Range Charts
- High Tool Ware Control Chart
- Sloping Control Charts, including regression analysis
Basic Control Chart Elements
- Upper and Lower Control Limits
- Centerline
- Out-of-Control Plotted Values
Interpreting Control Charts
The power of Control Charts in controlling manufacturing processes is frequently overlooked in industries. The primary reason is the misinterpretation or a lack of interpretation. This issue is addressed by providing comprehensive real-time pictorial examples that elucidate precise interpretations and the corresponding actions required based on the indications in Control Charts.
The charts are reviewed for:
- Out-of-control
- Runs
- Non-random patterns
How to Perform Statistical Process Control
- Select the type of control chart to use
- Determine the rational sub-group size and sampling frequency
- Determine measurement methods
- Ensure gage capability – calibration and MSA
- Calculate the control chart parameters
- Train
What are the Concerns of Statistical Process Control (SPC)?
- Improper sampling
- Lack of gage calibration and MSA evaluation
- Failure to address out-of-control conditions on control charts immediately
- Inadequate training
- Failure to react to the patterns of values
- Frequent changes in control limits
What is Process Capability?
Once a process has achieved a state of control, Process Capability can be assessed. It is an assessment tool that can be used to quantify the short-term and long-term performance of a process. A capability analysis will require a thorough understanding of the following:
- Customer specification limits
- Mean and standard deviation of the process
- Assessment of the normality of the data
- Calculations for performing a capability analysis
- Foundations for short-term and long-term estimates
Process Capability Indices
Process variation and process centering represent distinct characteristics in the manufacturing process. It is essential to understand each of them separately. These indices can be useful for:
- Measuring continual improvement using trends over time.
- Prioritizing the order in which processes will be improved.
- These indices should always be evaluated in pairs: Cp, Cpk and/or Pp, Ppk
How to Perform Process Capability
- Validate Specification Limits
- Verify normality
- Calculate mean and standard deviation
- Draw a graphical representation
- Calculate the capability indices
- Draw conclusions
What are the concerns of Process Capability?
- Process is not stable and in control
- Data is not representative of the population
- Lack of gage calibration and MSA evaluation (https://www.omnex.com/msa)
- Data is not normal
- Inadequate Training
What is Advanced Statistical Process Control?
More often, the real operational benefits of SPC are not realized on the shop-floor, primarily because of:
- Improper sampling
- Inadequate customization of the statistical technique for a given process.
- While X-R charts serve a very useful and easy introduction to the concepts of SPC, they alone cannot yield the benefits expected.
Advanced SPC is designed to provide knowledge inputs for helping organizations implement SPC by customizing the basic concepts to cater to the needs of a particular process.
Omnex courses also covers Control Test Methods for verifying the normality of the processes and the Control Charts used for controlling attribute characteristics. The introductory SPC course is recommended for all Control Charts users. The advanced SPC course is recommended for all Control Charts users. The advanced SPC course is highly recommended for designers of SPC applications for process control.
Statistical Process Control Training and Consulting
The training is delivered either as open enrollment or onsite, in both virtual and in-class sessions. Training provided by Omnex satisfies AIAG SPC 2nd edition requirements, as well as IATF 16949:2016 requirements. Excellent preparation for becoming a Certified Quality Engineer with American Society of Quality.
SPC Training Certification is issued upon completion.
- Open Enrolment Training: The class schedule and location can be found on our training website
- Onsite Training: We offer Private Training for organizations, which are recommended for groups of more than 5 people. This training is conducted at your location and can be customized based on your organization's specific needs. The training duration can vary from 1 to 3 days, depending on your organization.
- Six Sigma Private Training: We provide Six Sigma Private Training for organizations. For training information, please visit our Omnex training website
- SPC and Lean Six Sigma Continual Improvement Support: We offer on-site support for Statistical Process Control activities and Six Sigma implementation and training. Get in touch to experience our services.
Frequent Asked Questions
Prior to conducting any SPC studies, gage analysis must be completed.
SPC is applicable in any industry, including automotive, aerospace, medical devices, chemical, food, services, research and more.
SPC is applicable in various scenarios for assessing processes and product quality.
The personnel monitoring the process must collect actual measurements. The selection and organization of the statistical studies and the interpretation of the results must be performed by a trained individual.